The business cycle
The business cycle is also referred to as the economic cycle or even the trade cycle. Over time, the level of economic activity (and therefore the rate of economic growth) fluctuates. It seems to go through a cyclical movement with periods of above average (and some might consider excessive) rates of economic growth and periods of negative or low rates of growth.
By looking at the rate of economic growth over an extended period, there appears to be peaks, troughs, recoveries and downturns. Booms are associated with very high rates of growth in production – but not all peaks in the business cycle will be considered booms. Conversely, troughs are associated with very low rates of growth in production – but not all troughs will be considered a recession. For example, over 2008-9, the Australian economy went through a trough during the global financial crisis (GFC) but managed to avoid a technical recession (two successive quarters of negative economic growth). However, over 2020, the downturn in economic activity due primarily to the coronavirus pandemic, manifested in two consecutive quarters (i.e. half a year) of negative economic growth. This meant that that trough in the business cycle during this time resulted in a ‘technical’ recession. [Note that the word technical is used here because the definition of a recession being two consecutive quarters of negative economic growth is an arbitrary one.]
A complete cycle can take a short or reasonably long period of time. The time frame for each phase of the cycle will depend upon a range of factors that will be considered later. No two business cycles are identical and between 1991 and 2020 Australia enjoyed an extended period of positive (annual) economic growth. This was an unusually long period for a country to go without any type of significant downturn. Even the GFC, which caused recessions in many developed countries, did not result in an extended period of negative economic growth in Australia . [This was largely due to the fact that Australia was one of the few countries to leverage off the continuing strong rates of growth in China and the associated strong demand for Australian commodities such as iron ore and coal.]
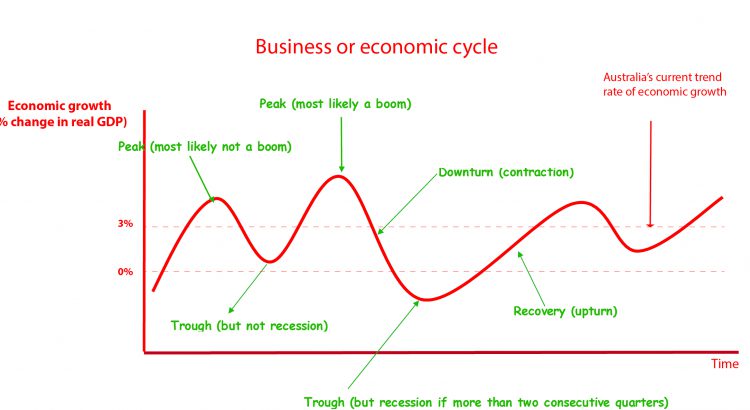
The business cycle can be represented in the diagram below.
The major points to note about the economic (business) cycle are:
- All cycles are characterized by peaks, troughs, recoveries and downturns;
- Not all peaks result in ‘Booms’ in economic activity;
- Not all troughs result in ‘recessions’;
- The length of each economic cycle is rarely the same (e.g. the length of one recovery and peak may be much longer than the recovery or peak experienced in the previous economic cycle).
Why do we have these cycles?
When the economy approaches a peak the following events are typical:
- spending and confidence are high;
- production is strong and capacity is heavily utilised; and
- unemployment is decreasing to much lower levels
When these factors are strong and pronounced (e.g. very high production growth, limited spare capacity and low rates of unemployment), the economy is said to be in a BOOM.
What normally accompanies a peak (particularly a Boom) is:
- increased wage pressures;
- higher interest rates (demand for money is high relative to supply);
- rising inflation (both demand and cost);
- overvalued asset prices (such property and shares);
- higher import levels as a result of production exceeding capacity; and
- a growing reliance on debt.
These factors then normally result in a contraction or downturn in the level of economic activity for reasons such as:
- increased costs via higher interest rates and wage pressures;
- a realisation that debt levels become unsustainable and asset prices are too high;
- reduced competitiveness of exports;
- lower confidence of consumers and producers; and
- decreased AD via lower Consumption, Investment, Exports (and higher imports).
The contraction is then characterised by:
- slow or declining rate of growth in production;
- underutilisation of capacity;
- high unemployment;
- low inflation and falling interest rates; and
- reduced wage pressures.
In this environment, with lower inflation, declining interest rates and falling wage pressures, the economy will eventually rebound (or recover) and the cycle inevitably continues.
If the contraction in the level of economic activity is protracted enough the situation is referred to as a RECESSION (technically defined as two consecutive quarters of negative GDP growth). The last time this occurred in Australia was during 2020 (due to the effects of the coronavirus) and before that during the early 1990’s, following the Boom of the late 1980’s. A prolonged recession is referred to as a DEPRESSION (e.g. Australia in the 1930’s)
While a BOOM is normally characterised by strong production, high inflation and low unemployment and recession by weak production, low inflation and high unemployment, since the 1970’s economies have, at various times, experienced situations of low production growth, high inflation and high unemployment. This is referred to as a period of STAGFLATION, which occurred in Australia between 1973 and 1983, with unemployment reaching a peak of 10.2% in 1983 and inflation averaging 11.6% per annum over the entire period! [Over 2022-3, with surge in commodity prices such as oil, gas and wheat (due to the conflict in Ukraine) and the ongoing supply constraints caused by the lingering effects of COVID-19 (e.g. shortages of labour and other key inputs into the production process), there was a possibility that stagflation would reoccur as cost inflationary pressures accelerated and AD declined in response to the erosion of purchasing power, declining confidence, lower investment (in addition to the tightening of monetary policy).]
The change in economic activity that took place over 2008-9, was a perfect example of the economic cycle in action. In early 2008, the government was still concerned about capacity constraints, excessive growth and inflation – signs that Australia was at the peak of the economic cycle. However, the USA sub-prime mortgage crisis that commenced in mid-2007 eventually developed into the GFC, with Australia’s corporate sector (particularly banks) heavily exposed to losses on loans that could not be repaid (because debt levels became unsustainable in the sense that the money was being used to purchase ‘overvalued assets). By the middle of 2008 it became very clear that shares, and property, were overvalued and that interest rate levels were too high. The Australian economy (like many other economies) quickly entered the downward phase of the economic cycle (i.e. a contraction). Business and consumer confidence dipped to historically low levels, share prices crashed, property price growth moved into negative territory in most markets and inflationary pressure became relatively insignificant such that the RBA quickly moved to reduce the cash rate (the key interest rate in the economy) from 7.25% in March 2008 to 3.00% by April 2009. Since Australia reached the trough in the economic cycle in December 2008, its growth rate has been both positive, and larger than anticipated, a sign that we entered the recovery phase of the economic cycle earlier than most other developed economies. This is despite the negative growth experienced in early 2011, which was largely attributable to the natural disasters.
The economic conditions faced by Australia in 2020-21 were similar to those experienced in 2008-9, with the economy being hit by the impact of two major negative forces: the bushfires and the coronavirus. Consumer and business confidence fell to extremely low levels and the virus, in particular, delivered massive shocks to both the demand and supply sides of the economy. On the demand side, consumers were either reluctant or unable to spend on goods and services, and businesses were loathe to invest in an uncertain business climate. On the supply side, businesses ceased production to prevent the spread of the virus and then faced further government imposed restrictions (e.g. forced closures of many businesses during lockdowns). In addition, access to labour and other key inputs in the global supply chain were disrupted.
While the effects of the natural disasters/COVID-19 upon economic growth are similar to the effects of the GFC, they differ in that the 2020-21 downturn was primarily triggered by a health event. In contrast, the GFC induced downturn was triggered by an economic event (e.g. excessive debt) that is consistent with normal swings in the business cycle.
Since 2021, the economy entered the recovery phase of the business cycle, with economic growth exceeding 3% for the year ended 2021 and unemployment falling to extremely low levels (less than 4% over 2022-3). However, by March 2022, the economy experienced further supply shocks in the form of the East Coast floods and the war in Ukraine. This led to an increase in inflationary pressures, declines in business and consumer confidence and the associated negative impact on AD and real GDP. Growth over 2023 has been subdued, with the supply constraints impacting on inflation and economic growth, despite unemployment remaining very low (at or below 4%). Without the return of strong population growth in Australia (due to immigration), economic growth will have been negative over 2023, which is reflected by growth in real GDP per capita being negative over this period. See living standards.

In this video, notice the different way of drawing the business cycle diagram. The difference between this diagram and the red and green one drawn earlier is simply the y-axis. If ‘real GDP’ is used (which is the absolute level of real production) then we end up with a rising trend rate of growth line, which makes sense given that the size of economies typically grow over time in line with growth in the quantity of resources (e.g. growing population and more labour) and the quality of resources (e.g. growth in productivity). In the diagram used above, the trend rate of growth line is flat because the y-axis refers to ‘% growth in real GDP’. Regardless, both diagrams tell exactly the same story. 🙂
Read from 3:00 where Jacob starts to talk about the business cycle
Course notes quick navigation
1 Introductory concepts 2 Market mechanism 3 Elasticities 4 Market structures 5 Market failures 6 Macro economic activity/eco growth 7 Inflation 8 Employment & unemployment 9 External Stability 10 Income distribution 11.Factors affecting economy 12 Fiscal/Budgetary policy 13 Monetary Policy 14 Aggregate Supply Policies 15 The Policy Mix