Production Possibility Frontier (PPF)
This is also referred to as the Production Possibility Frontier (PPF). It is an abstract tool used by economists to highlight concepts such as:
- opportunity cost;
- productive capacity;
- productive or technical efficiency (or inefficiency);
- allocative efficiency;
- dynamic efficiency; and
- intertemporal efficiency.
It relies on a number of simplified assumptions, the key ones being:
- only two goods are being produced in an economy;
- all resources or factors of production can be used in the production of either good; and
- if all resources are being used efficiently, the economy’s productive capacity must ‘bounded’ by the curve (i.e. a country cannot produce beyond this point at the current time).
Points to note about the PPC are as follows:
- A movement from one point to another means a country is allocating more to the production of one good and less to another (this happens every minute in economies around the world) which necessarily involves a sacrifice of the production of another good (i.e. opportunity cost).
- The opportunity cost associated with the production of one good typically increases as more of this good is produced, which is reflected by the concave (bowed) shape of a typical PPF.
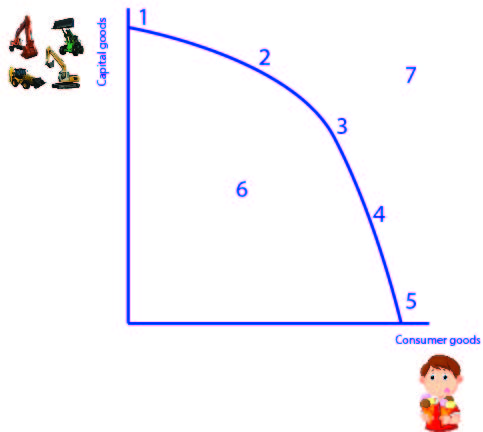
- Only one point on the curve is efficient in terms of what is best for the economy or country (and this usually represents that point where consumers’ aggregate or total satisfaction is maximised). To highlight this point, assume that with the PPC to the right, an economy can produce capital goods, like factories and machinery and consumer goods, like food and clothing. Whilst production possibilities 1-5 are ‘efficient’ in the sense that maximum output or production is achieved with minimum inputs or cost (productive efficiency), 1 and 5 are immediately ruled out as the best allocation of an economy’s resources. This is because neither would be in the best interests of the economy – all consumer goods and no capital goods would result in short term satisfaction at the expense of longer term reductions in the ability to produce consumer goods. Further, all capital goods and no consumer goods would result in longer term growth potential but short term starvation of people. There can only be one point on the curve that is efficient in an allocative sense. In other words, for any economy, there can only be one point that provides the ‘best’ use of the nation’s resources (allocative efficiency).
Points outside the curve (e.g. point 7) are not achievable today, but are achievable in the future via an increase in the quantity or quality or resources. In other words, if an economy finds more resources (such as additional minerals or more labour via immigration) it will have the ability to produce more goods and services. In addition, more goods and services will be able to be produced if an economy’s resources become productive via an investment in training and education of workers or the development of new technologies.
Points inside the curve (e.g. point 6) are neither technically/productively or allocatively efficient. These points will typically characterise an economy with unemployment and/or underemployment of resources (e.g. workers without jobs and machinery lying idle).
All production points along the PPC are equally efficient in the respect that the economy is producing the maximum volume of goods and services possible with its available resources (that is, technical or productive efficiency is being achieved).
The speed or pace at which an economy can move from one point on the PPC to another can reflect the level of ‘dynamic efficiency‘ existing in the economy (see next page).
The point of production on the PPC can also reflect the level of ‘intertemporal efficiency‘ that exists in an economy (see next page).
Jacob does a great job of explaining opportunity cost. For those students wondering why the PPC has a concave shape, jump to 3:20 in the clip.

Course notes quick navigation
1 Introductory concepts 2 Market mechanism 3 Elasticities 4 Market structures 5 Market failures 6 Macro economic activity/eco growth 7 Inflation 8 Employment & unemployment 9 External Stability 10 Income distribution 11.Factors affecting economy 12 Fiscal/Budgetary policy 13 Monetary Policy 14 Aggregate Supply Policies 15 The Policy Mix